






“Eqolux has brought clarity, structure, and purpose to our strategy. It’s not just a tool, it’s a real driver for change.”
Marine Deconinck — Head of ESG, Le Meurice Paris

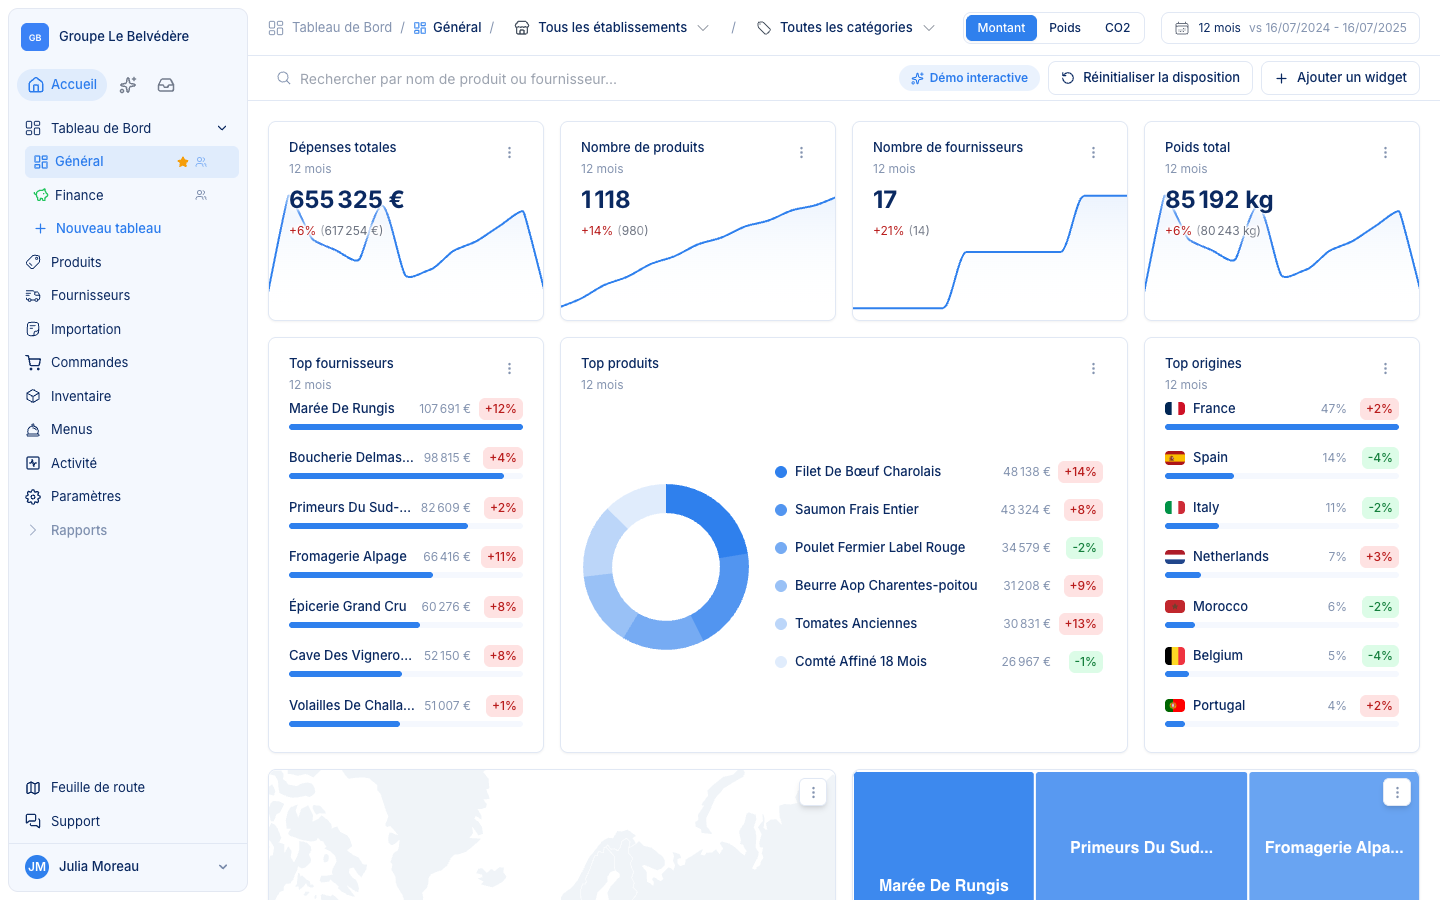
Build named, shareable dashboards — KPIs, price spikes, origins, top suppliers — per site and per period, without a single line of SQL.
No commitment · Live in days · Trusted by premium multi-site groups


KPI tiles, origins map, top suppliers, price spikes: drag, drop and resize widgets to build the view each team actually needs.
Named dashboards with shared visibility — set one as the group default so everyone lands on the same numbers.
Custom date ranges and year-over-year comparison, per site and per category — trends stop hiding in spreadsheets.
No more exports and stale spreadsheets: the data is already there, up to date, in one place.
Book a demo: we’ll show you your own data inside Eqolux.