
Changelog
Product updates and improvements.
The last day of each period, now counted
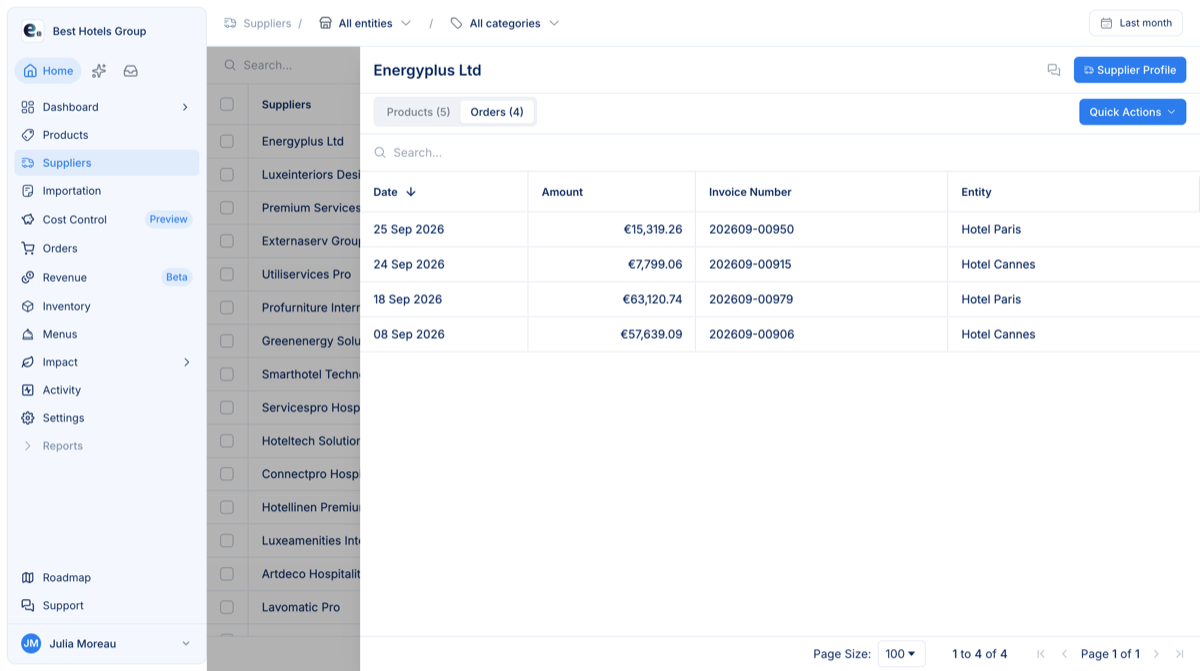
A round of fixes — starting with one that changes your month-end totals.
- Exact period bounds — the last day of each selected period (the 31st of a month, for instance) is now included everywhere: dashboard KPIs and widgets, Products and Suppliers lists and drawers, year-end rebates, the Products report and Reconciliation. Rows dated on that last day could previously be left out, which understated month-end figures.
- Products page and dialogs — “Min Price” and “Max Price” in the “Prices” card now match the range shown in the table, and dialogs opened from a drawer (“Fixed price”, for example) appear above it instead of behind it.
- Supplier drawer, tidier — “Orders” now lists orders newest first (you can still change the sort from the column header). Right-click then “Export” produces a readable CSV or Excel file: origins and entities are spelled out, empty or invalid values are gone, and in Excel prices and totals remain real numbers you can calculate with. Clicking a product opens one product drawer instead of two stacked ones.
- Dashboard search mode — once you click into the search field, clicking a top supplier now opens its drawer, and suppliers that share a name appear as distinct rows, as in report mode.
Line highlighting on PDFs: the right line or none
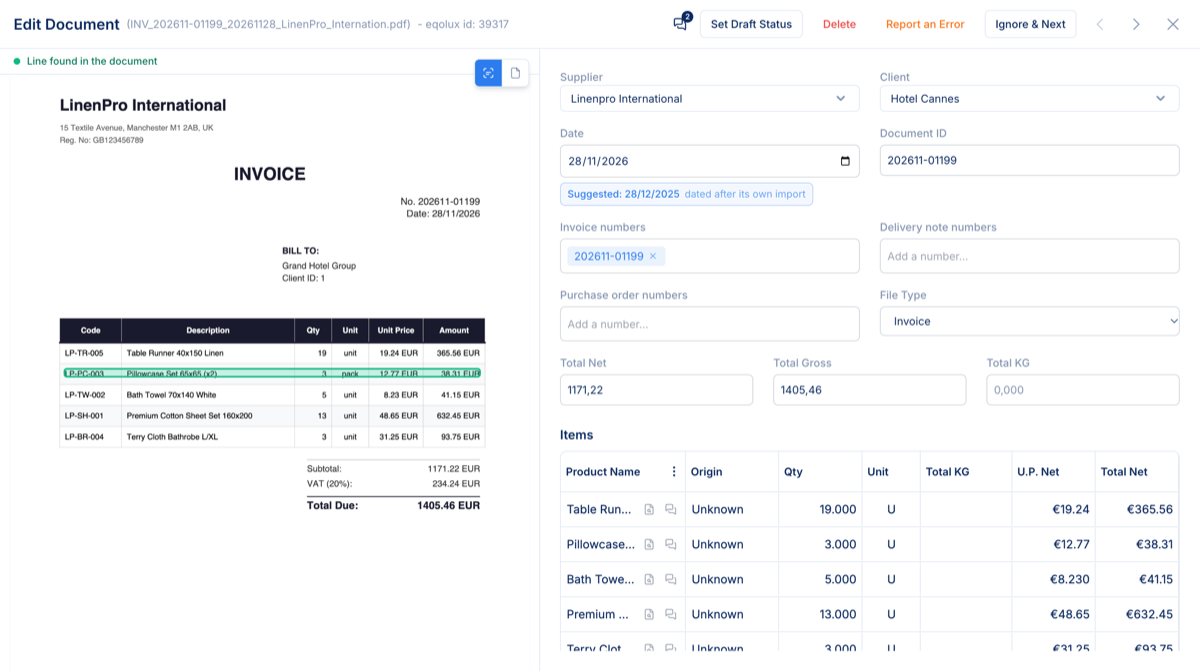
Checking a figure against its source only works if the highlight lands on the right line — the viewer now frames that line or nothing at all, and on our test set of 60 delivery notes not a single wrong frame remains.
- A frame only when the line is certain — a line is framed only when its product code is found on the document or, for lines without a code, when its label and one of its amounts are both found, figures being compared at the precision they are printed at. When two lines cannot be told apart, nothing is framed: a wrong frame is worse than none. On a tilted scan, the frame follows the slant of the row.
- Amounts in the document’s own currency — when a document is in a currency other than your display currency, its amounts are first read back in the document’s currency, so they can be matched on the PDF.
- Scans that no longer get stuck — on a scanned document, text recognition now has a time limit and is no longer re-run every time you click a line; “Scanning document…” stays visible while it runs.
- A quieter viewer — earlier this month, the orange “Line not located — showing document” banner went away: the document simply opens, and the previous document’s frame no longer reappears when you open a new one.
Permission groups and owner rights, made reliable
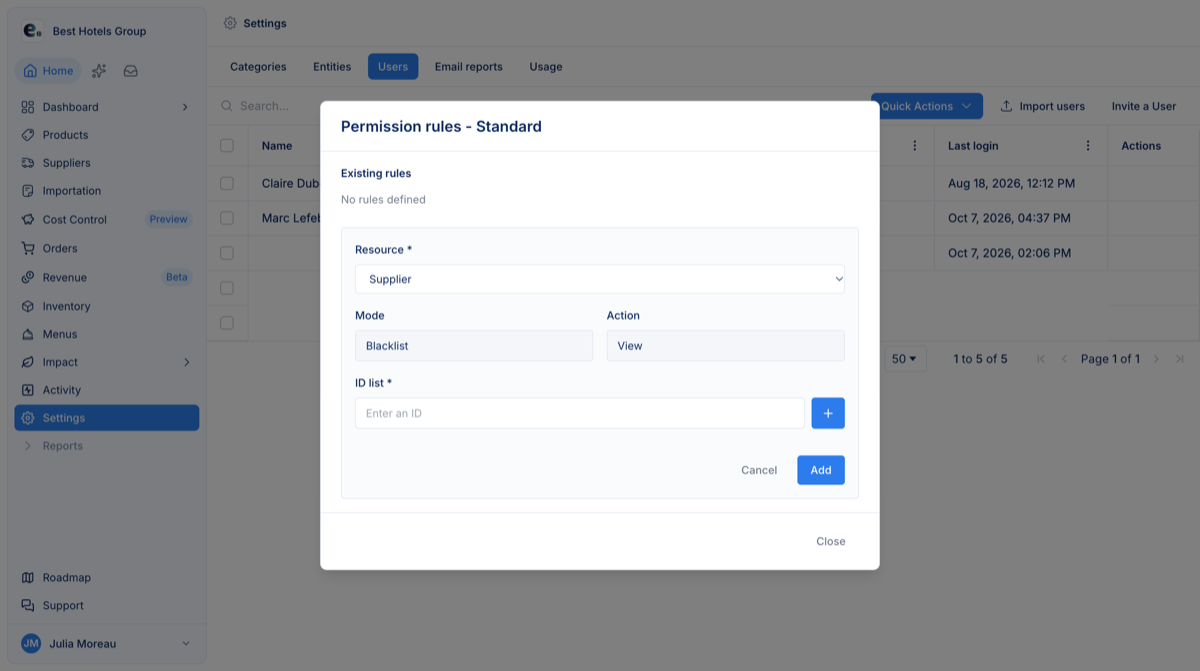
Who administers your account is now explicit: an Owner group in every organisation, and everyone else keeps working without surprises.
- An Owner group in every organisation — this is the group that grants administration rights (managed by the platform, read-only); new organisations also get a default group named “Membres”, with full data access, preselected when inviting a user.
- Owner-only actions, clearly marked — a member who is not an owner now sees the administration actions of the Users tab greyed out, with a note that they are reserved for the organisation’s owners, or simply hidden, instead of being signed out.
- Permission rules, instantly and in your language — every group’s rules are ready as soon as the Users tab opens, so “Manage rules” opens at once, and the window now follows the interface language.
- Smoother permission groups — a group change shows immediately in the grid, the “+” button adds an ID to the “ID list”, and existing rules can now be edited.
Split one PDF into several documents
One scanned batch, several invoices or delivery notes in a single PDF: split it into separate documents straight from the drawer — an action previously limited to documents flagged as duplicates.
- “Split pages” in the drawer’s quick actions — the window shows the PDF pages as thumbnails; click the pages that stay in this document; the others become either one new document or one document per page, depending on the “Pages not selected” option.
- See the result before you commit — “This document” / “New document” cards show which pages go where, each labelled “Will be modified” or “Will be created”; the “Split the document” button stays disabled as long as nothing would change.
- New documents ready to review — they inherit the supplier, entity, date and document type of the original, then go through OCR: lines are rebuilt and every affected document goes back to draft (with an explicit warning beforehand if the original had been approved); a result panel lists the new documents with an “Open” button.
Data cleaning: a guided pass after every import
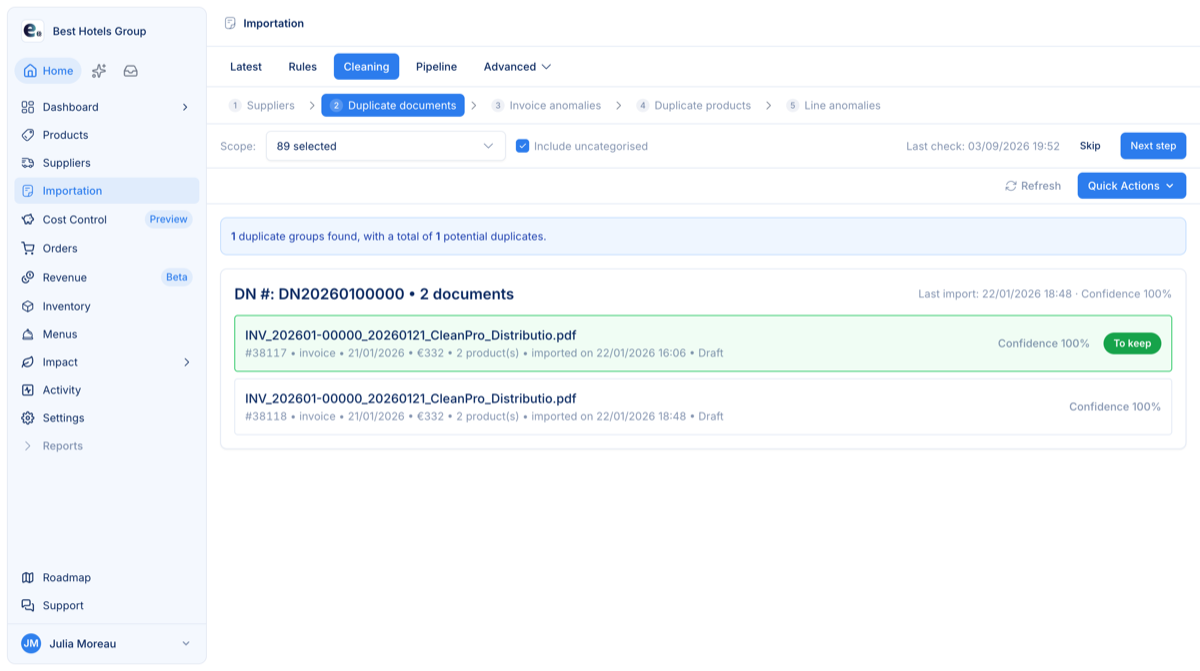
Clean your purchasing data in five ordered steps, on the categories you choose, and pick up where your team left off: a new Cleaning tab on the Importation page guides post-import correction.
- Review only what changed — finishing a pass records a “Last check” date, shared across the organisation when an owner or admin runs it; everything newer carries a green NEW tag: suppliers, duplicate-document groups with a fresh import, invoices whose total does not match their lines (moved to the top). The lists themselves stay complete: NEW is a tag, not a filter.
- Your scope, set once — pick one or more product categories (ticking a parent category includes all its sub-categories; untick “Include uncategorised” to leave those out): from the Duplicate documents step onward, the tables are re-filtered instantly, and your categories are remembered between passes.
- Five steps in a fixed order — Suppliers → Duplicate documents → Invoice anomalies → Duplicate products → Line anomalies, each with its own URL to share; the individual tabs stay one click away in the “Advanced” drop-down.
- Invoice totals and dates, cleared faster — in the “Invoice anomalies” step, “Apply the OCR total” settles in one click every invoice whose printed total already matches its lines. A comment per invoice and “Hide commented” keep the list to what remains. The new “Incoherent dates” view flags documents dated after their own import, undated or far too old, with a suggested date wherever one can be worked out, to apply one by one or in bulk.
Adjust a shared dashboard, keep your own copy
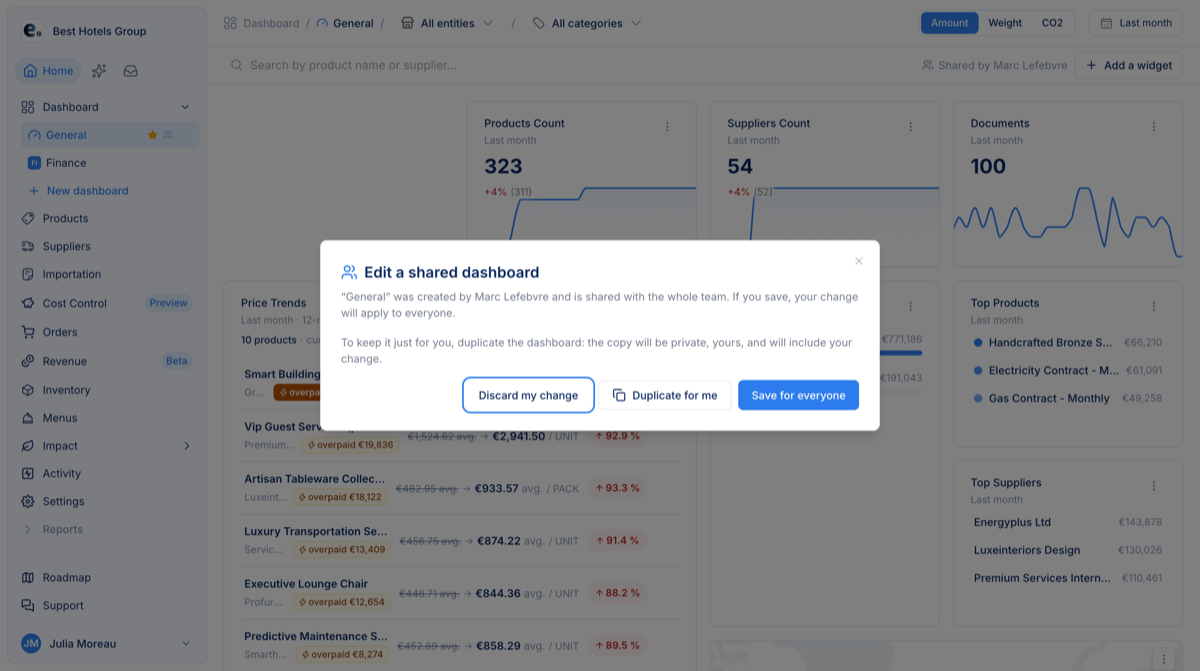
A dashboard built by a colleague is no longer frozen: try your change, then keep it as a private copy.
- Try a change directly — on any dashboard shared with the team, move, resize, add or remove a widget without asking its author; the toolbar shows who shared it (“Shared by …”).
- A prompt before anything is saved — the first time a change is about to be saved, the “Edit a shared dashboard” prompt reminds you that the dashboard is shared with the whole team and lets you choose “Duplicate for me” or “Discard my change”; account owners can also pick “Save for everyone”.
- A private copy, already up to date — “Duplicate for me” creates a private dashboard that already includes your change and switches to it; the original is left untouched. The same action sits in the ⋯ menu of any teammate’s dashboard in the sidebar.
Invoice statements and expense reports, counted once
A statement that recaps invoices already received is not a new purchase — the import now knows the difference.
- Each amount counted once — an invoice statement or an expense report no longer inflates your purchases: lines that merely restate an amount already carried elsewhere in the same document (statement recap lines, expense-report receipt lines) are skipped, so the remaining lines add up to the document’s total and nothing is counted twice.
- Two new document types in the drawer — “Invoice Statement” and “Expense Report” join the “File Type” selector of the document drawer, in all five interface languages; a statement also carries the number of every invoice it recaps, so each one stays traceable. Under “Total Net”, a note says how many lines were skipped and why.
- Filter by type in Importation › Latest — the “Latest” tab gains a “Document type” filter: pick a type, or “No type” for documents that have not been assigned one, and combine it with the entity filter.
Importation: a receipt for every file, tracking for owners
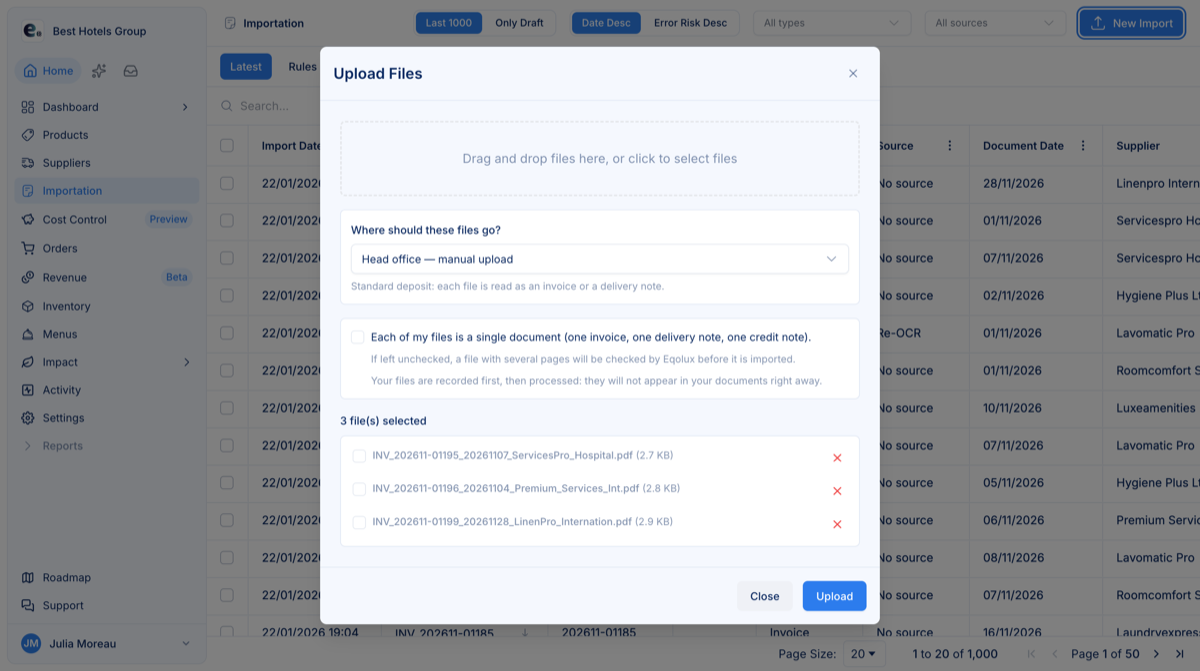
Every file you upload now comes with a receipt, and organisation owners can see what happens to it afterwards.
- A status for every file — every upload ends with a status: “Received — will be imported in the next processing run”, “Received — Eqolux will check it before import if it contains several documents”, “Already received (duplicate upload)” or “Rejected”, with the reason (format, size, unreadable file). Files are recorded first and processed at your organisation’s next run; tick “Each of my files is a single document…” and they are imported without the multi-document check, whatever your organisation’s usual setting.
- Importation › Latest, now more useful — a “Document No.” column, placed right after “File Name” and with its own filter, shows the number read on the document itself. “Download the file” saves a row’s source file under that number; “Download files (N)” does the same for a whole selection, each file keeping a distinct name so nothing is overwritten.
- A Pipeline tab for organisation owners — see what is waiting, blocked, refused, or received but not yet picked up. Since late September, each run reads “N picked up · M delivered”, and a run queued behind another one says so instead of “nothing to process”. “Run now” processes everything that is ready without waiting for the next run, and warns you first if the request will have to wait.
- Unblock a refused deposit without re-uploading it — when the import robot refuses a file, owners can use “Put back in the queue”; if the file carries a service code not yet attached to one of your entities, “Fix the client mapping” lets you attach that code or ignore it, and if the file itself is at fault, the card says a corrected file is needed.
Reconciliation: count each delivery once
A new page — available on request — that puts an end to a classic distortion: the same delivery counted twice, once on the delivery note and once on the invoice.
- One group, one amount counted — the invoice, delivery note and purchase order of one delivery form a group, and only one of them is counted in your spend: on the dashboard, on the Suppliers page and in reports alike. The end of double counting between the documents of a reconciled delivery.
- Coverage per supplier, provision included — one row per supplier shows how much of its delivery notes is already invoiced and opens the list of covered and uncovered documents; those still waiting add up to a provision, which you can top up with manual adjustments and recalculate as of any cut-off date you choose.
- Link by hand, or accept the suggestions — “Reconcile” lets you pick the supplier’s matching document yourself; “Auto-match” works from the delivery-note numbers quoted on invoices and shows its proposals before you apply them.
- Gaps compared line by line — groups whose totals disagree are sorted by the size of the gap in the Gaps tab and compared line by line; select any line to see it highlighted on the document itself.
Cost Control: turn price drift into a savings plan
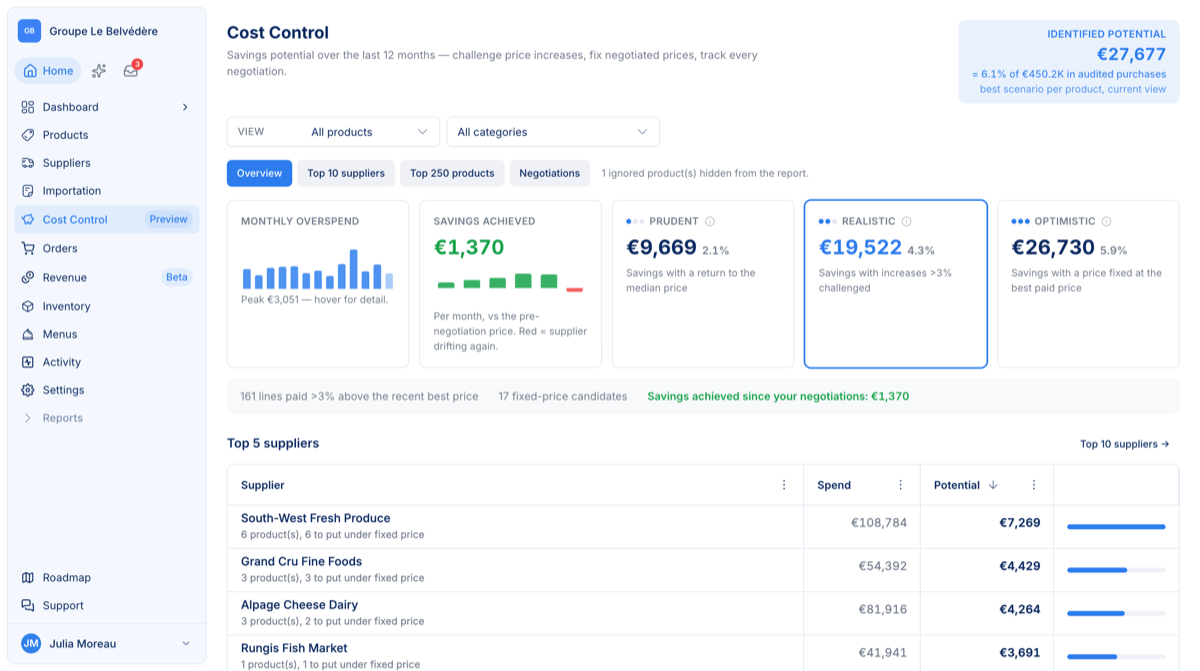
A new page — in preview — that turns twelve months of purchasing history into a concrete negotiation plan.
- Identified potential, three assumptions — prudent (back to the median price), realistic (increases above 3% challenged), optimistic (price fixed at the best paid price), each shown in value and as a share of your audited purchases.
- A working list that ends in signatures — top suppliers and top 250 products ranked by overcost, with a negotiation status, an owner and a target price per product; “ignore” a line when the increase is justified.
- Savings achieved, verified monthly — once a negotiated price is fixed, green/red monthly bars track the real gains; red means the supplier is drifting again.
- Saved views, category filters & comments — private or shared views, fine-grained category inclusion/exclusion, and a comment thread on every product line.
Price increases you can actually act on
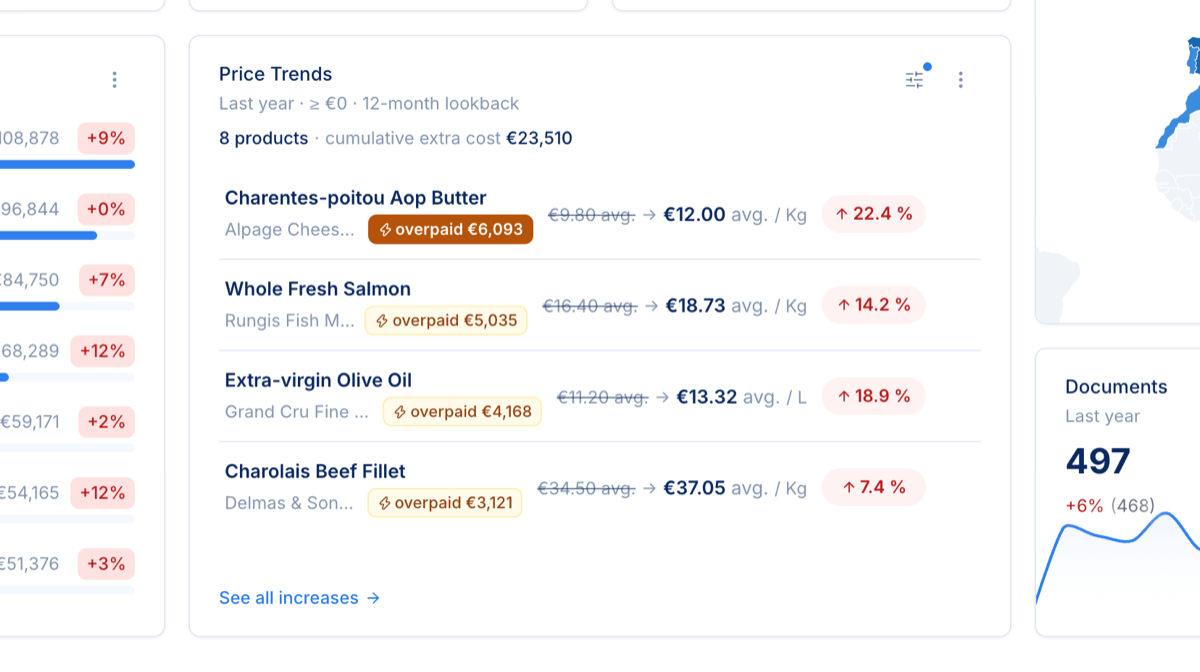
The Price Trends widget was rebuilt around one question: how much is this actually costing us?
- Overpaid, in value — products are now ranked by cumulative extra cost over the period, not just by percentage, and the widget shows the total at a glance.
- A lookback window — compare today’s price to the price 3, 6, 12 or 24 months back, with the real dates of both prices in the tooltips.
- Price per kilo where it belongs — a per-product price basis neutralises packaging switches that used to masquerade as +500% spikes.
- Pin a category — or a Cost Control view — every widget instance can follow its own category or a saved Cost Control view, and “See all increases” jumps straight into the full report.
Your dashboard, scheduled into your inbox
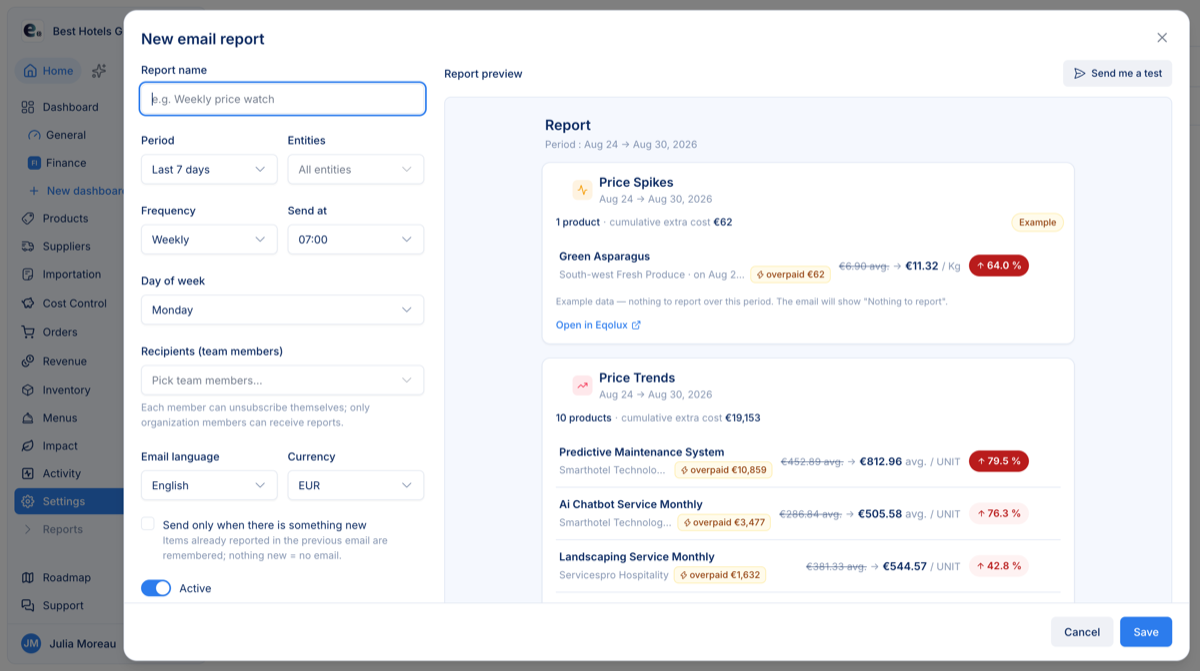
Watching prices shouldn’t require logging in. Email reports send your dashboard widgets on your schedule — and you compose the email as the email.
- Widget sections, mirrored from your dashboards — price spikes, price trends, unauthorized origins, fixed-price gaps, non-recommended suppliers; drag to reorder, size each section.
- A live preview on your real data — the editor renders the actual email, and “Send me a test” delivers it to you right now.
- Scheduled and considerate — frequency, day and hour, team recipients with self-service unsubscribe, and “only send when there is something new”.
- Deep links — every section links back to the exact widget on the exact period, highlighted on arrival.
Faster pages, tighter details
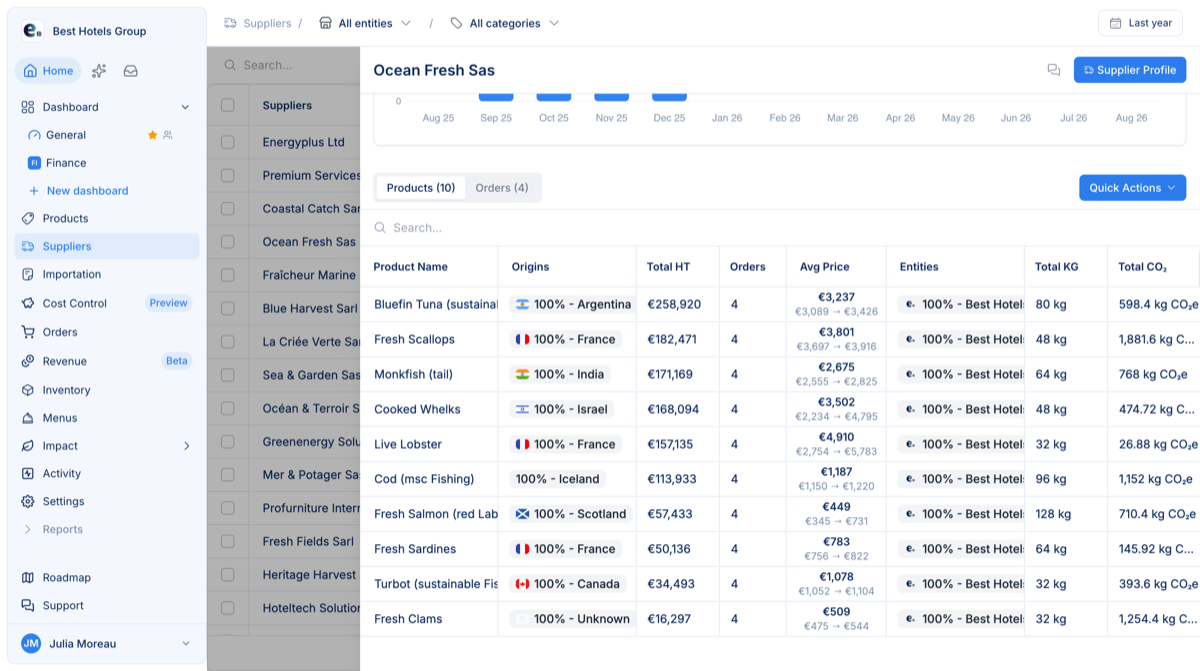
A polish pass across the app.
- Supplier drawer: Products and Orders tabs — a supplier’s orders are now one tab away from its products, searchable, and each row opens the delivery note.
- The Products page loads faster — fewer requests and smarter caching on the heaviest page of the app.
- Five languages, no gaps — about 270 missing interface translations were filled in across English, French, Spanish, German and Arabic.
Team & entity administration, done properly
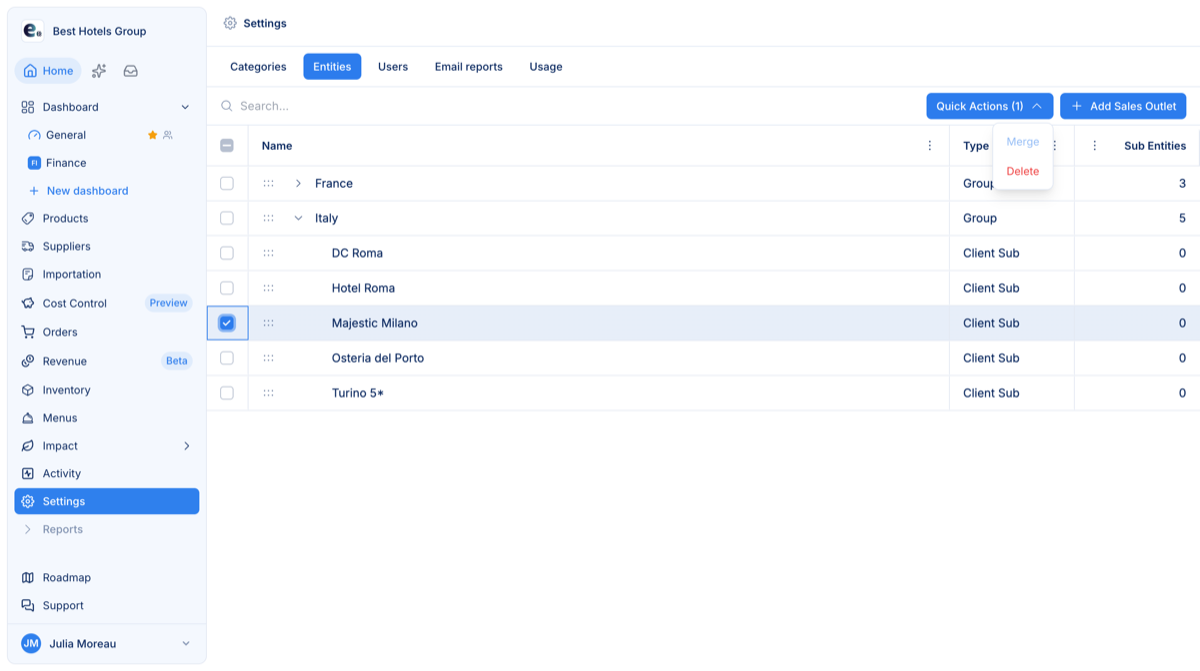
A batch of upgrades for the people who run the account.
- Invite, re-invite, import — resend invitations to teammates who never signed in (one by one or in bulk), import users from an Excel template, and manage permission groups.
- Delete an entity without losing history — an impact report lists everything attached first (documents, order lines, users, import rules…); when data is attached, deletion becomes an explicit merge into the entity you choose. Nothing is lost.
- Know your usage — a new Usage tab shows the pages scanned this calendar year against your plan’s quota.
Allowed origins & non-recommended suppliers
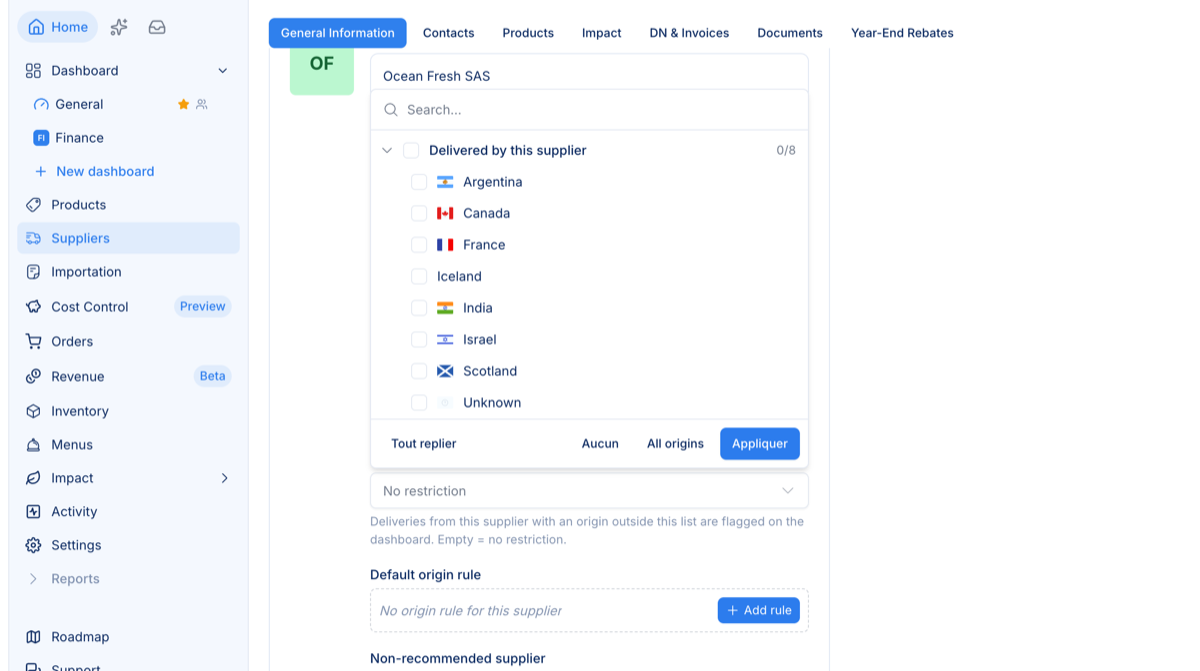
Purchasing policies only work if the tool enforces them. Two guardrails now live on the supplier sheet.
- Allowed origins — tick the origins a supplier may deliver; any delivery imported from outside the list is flagged in a dedicated “unauthorized origins” dashboard widget.
- Non-recommended suppliers — flag a supplier you are phasing out; a dashboard widget lists the orders still being placed with them, with amounts and last order date.
- Neutral by default — both guardrails are opt-in, supplier by supplier; nothing changes until you set them.
Track your cost / revenue ratio
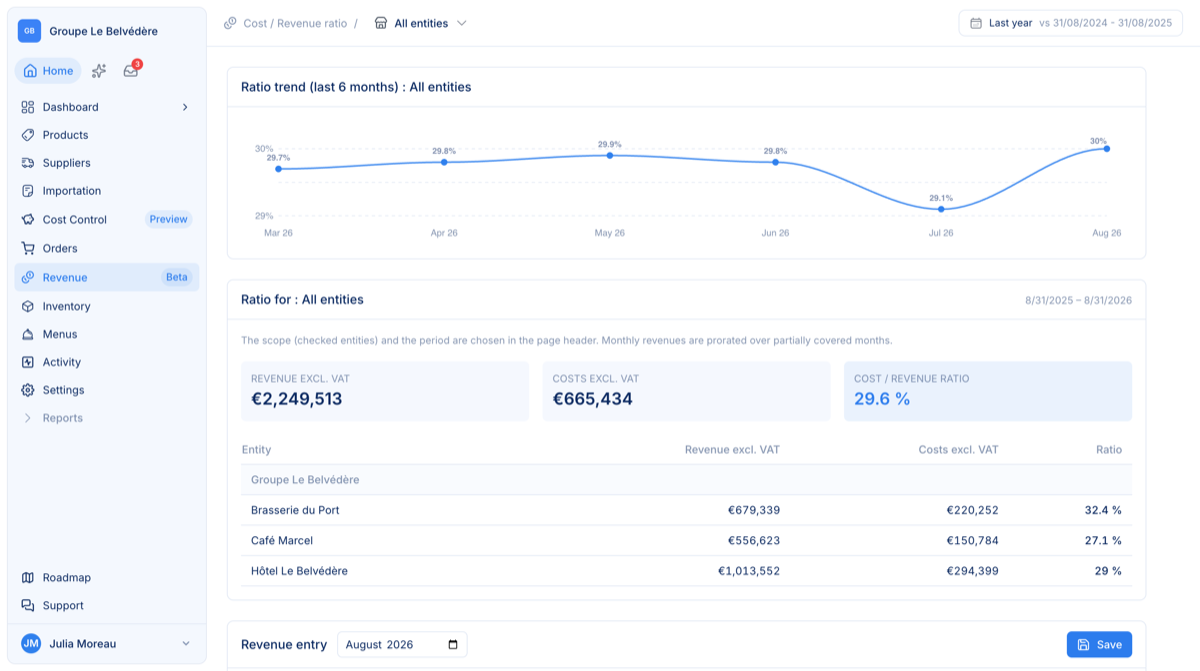
Eqolux already knows your purchasing costs. Feed it your revenue and it watches the number every F&B director runs on. Rolling out in beta, enabled on request.
- Monthly revenue entry per entity — a flat, fast input list; groups roll up automatically.
- Ratio by property and for the group — scope it with the header’s entity checkboxes, pick any period; partially covered months are prorated.
- A six-month trend — see the ratio drift before it becomes a quarter problem.
- Dashboard widgets — revenue over the period and a per-property breakdown, scoped like the rest of your dashboard.
Merge & split pages on duplicate documents
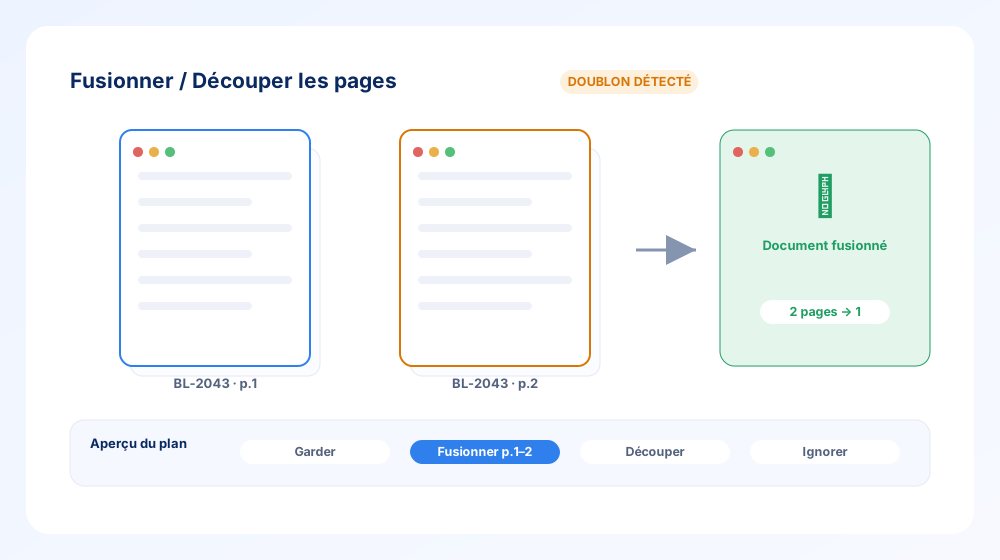
When the same document arrives scanned across several pages — or two documents get stitched into one — you can now repair it without leaving Eqolux.
- Merge / split mode on document duplicates, so multi-page scans become a single clean document.
- Plan preview with thumbnail zoom — see exactly what will be kept, merged or split before you commit.
- Part of the new Anomalies V2 workspaces, at both the invoice and line level (V1 has been retired).
Categories in every user's language
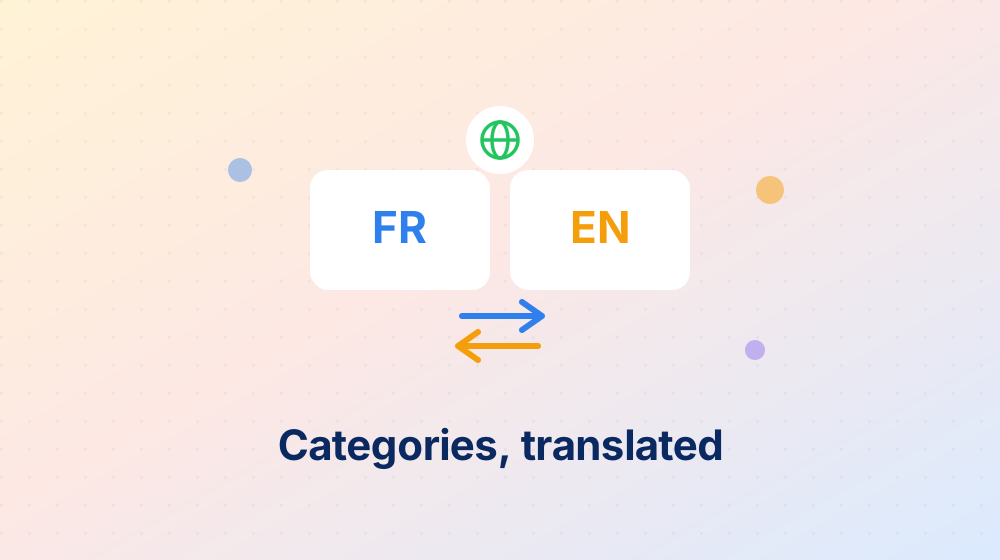
International groups share one category taxonomy — but not one language. Now they don’t have to.
- Translated display: every user sees category names in their own interface language.
- Name & translation editor: manage a category’s canonical name and its translations from one place.
Julia now produces exportable artefacts
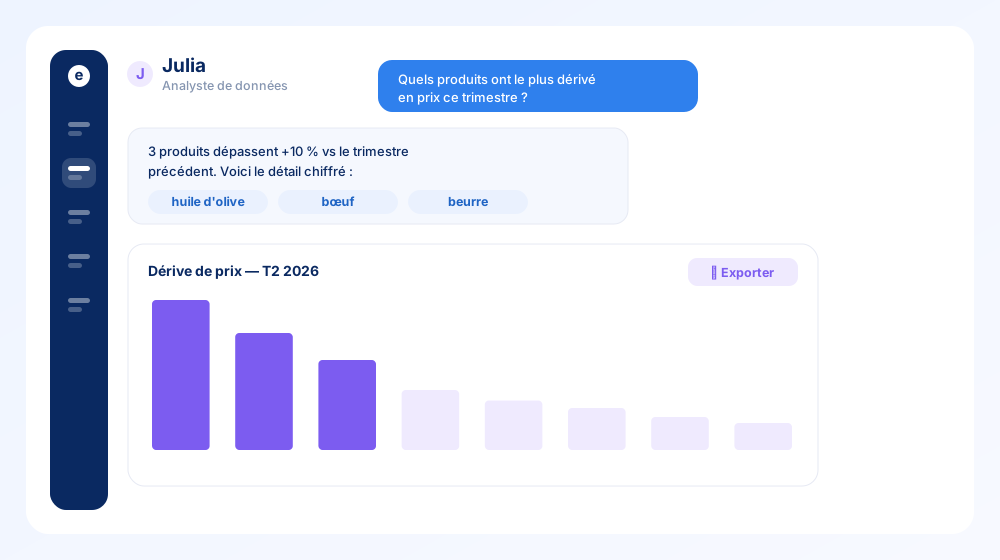
Julia, the built-in AI data analyst, becomes something you can actually hand around.
- Exportable artefacts — the charts and tables Julia builds from your data can be exported and reused.
- Message authorship — every message and comment now shows who (or what) wrote it, so a thread stays readable.
- Answers link straight to the underlying products, suppliers and documents.
Reports: multi-entity, custom periods & Excel export
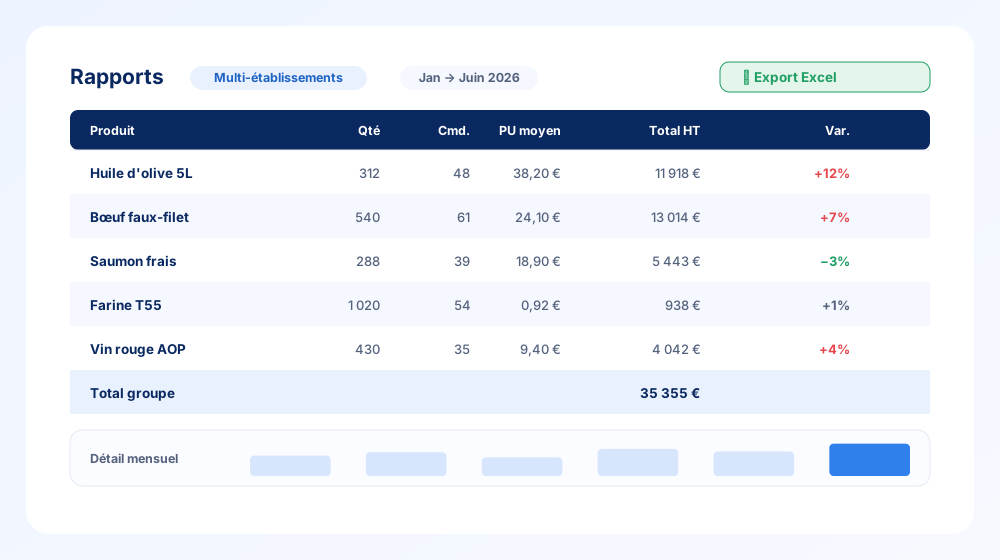
The Reports page grew up into a proper analysis tool.
- Multi-entity filter — combine several properties (or your whole group) in one report.
- Selectable period with monthly detail: quantity, number of orders and unit price, month by month.
- One-click Excel export of the full table.
- A dedicated app header (points of sale + global period) and a table options bar to shape the view.
Bulk approval and clearer credit notes
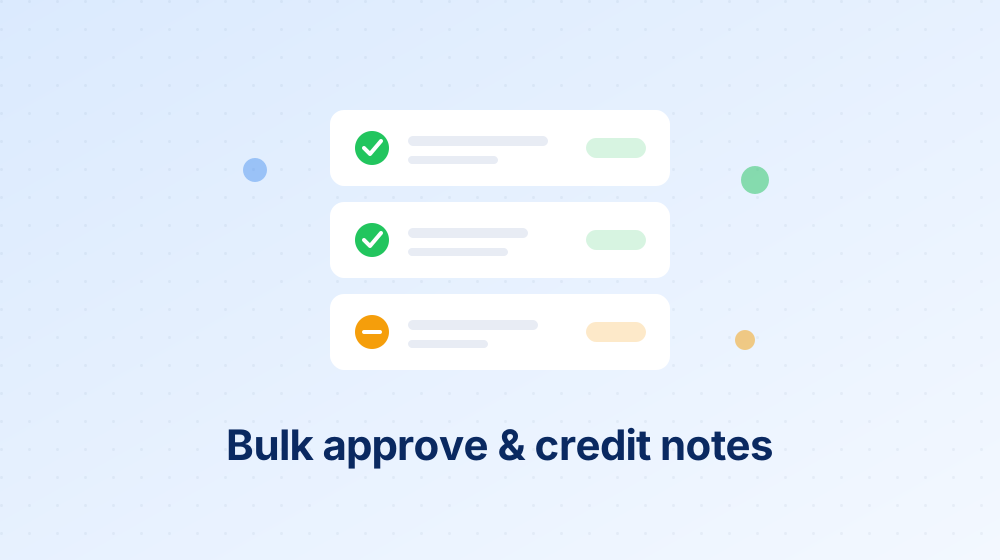
Two quality-of-life upgrades for the daily document routine.
- Bulk approval: select several delivery notes on the Latest tab and approve them in one action.
- Credit notes shown as negatives across product views, so line totals and supplier totals finally read the way your accountant expects.
Read delivery notes your way — and handle credit notes
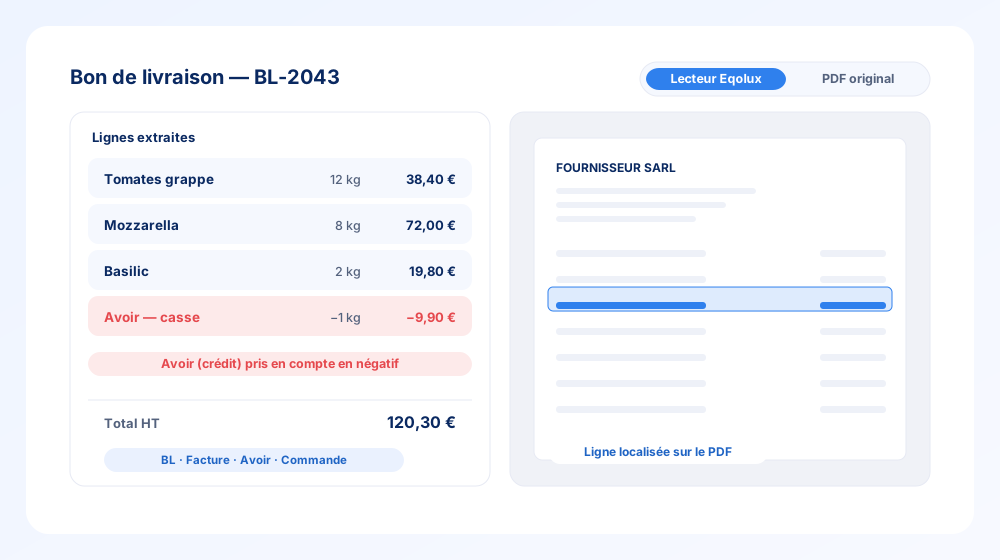
Delivery notes and invoices are now much easier to check against their source.
- Reader ↔ original PDF toggle — flip between Eqolux’s clean extraction and the raw document instantly.
- Locate & highlight a line on the PDF from the extracted data.
- Multi-number editing — BL, invoice, credit-note and order numbers stored as arrays, editable together.
- Credit notes (avoirs) now display in negative, so totals reflect reality.
A workshop to correct purchasing anomalies at scale
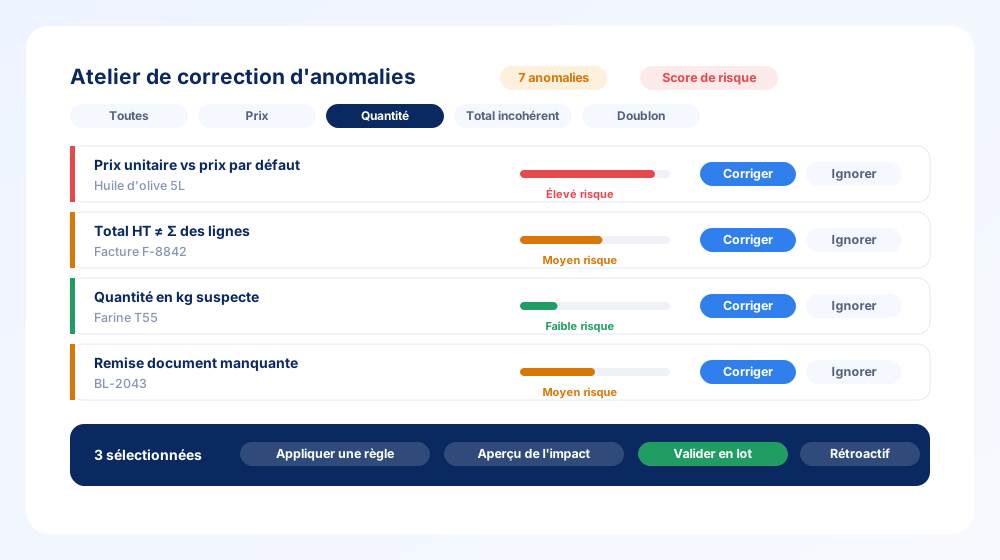
Anomaly review becomes a real workflow instead of a to-do list.
- Grouped actions — fix or dismiss dozens of anomalies at once.
- Risk score to triage what actually matters first.
- Rule-based detection: unit price vs default price, inconsistent totals, suspicious kg quantities, missing document discounts, and more.
- Impact preview before applying — and the option to apply a rule retroactively.
- URL-persisted filters so your view survives a refresh.
Comments, @mentions and notifications everywhere
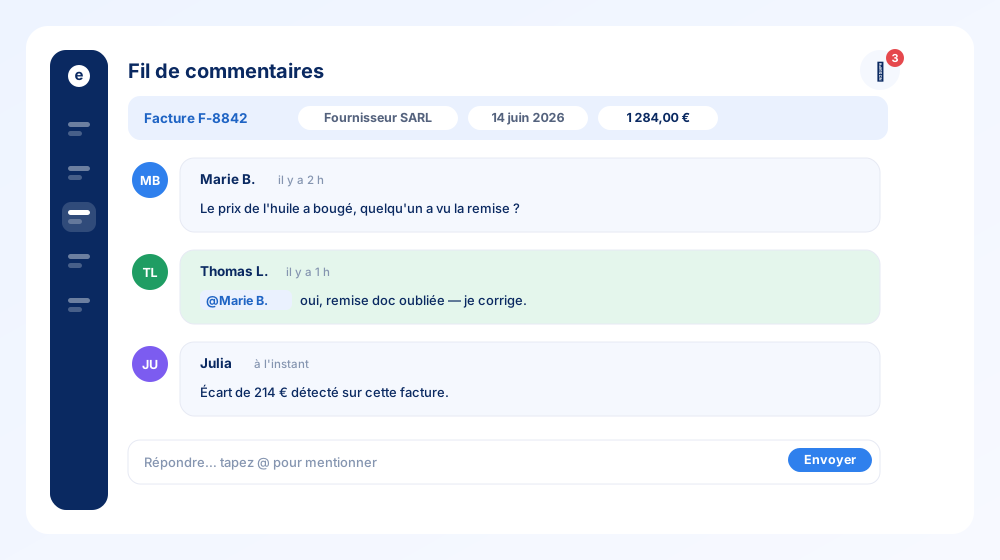
Purchasing decisions now have a place to happen — right next to the data.
- Universal comments on documents, products and suppliers, labelled with supplier, invoice date and amount for context.
- @mentions that trigger a localized email notification (via Postmark).
- A new sidebar with Home / Julia / Inbox tabs, gathering comment mentions and your Julia history in one place.
A refreshed, more consistent interface
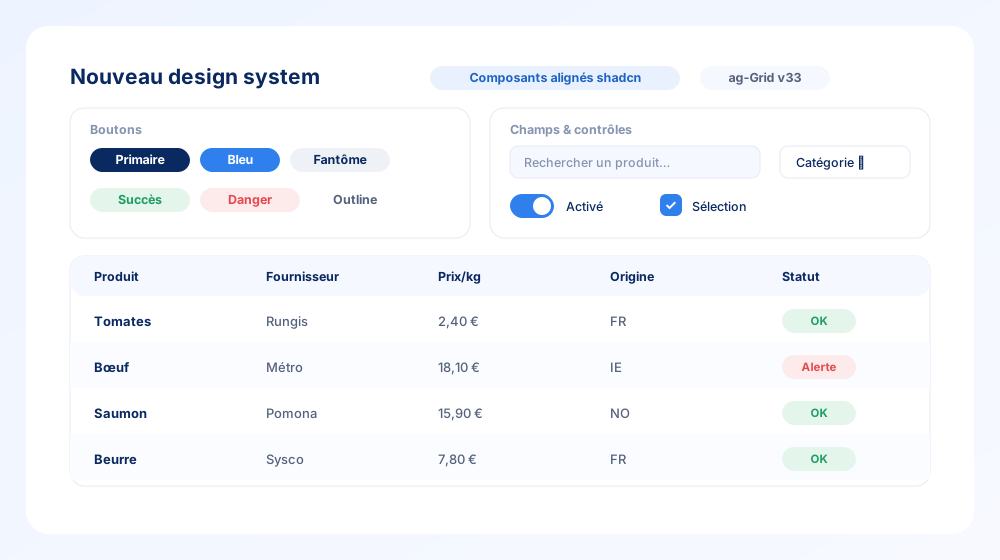
The whole app got a coherence pass.
- New UI primitives — buttons, inputs, toggles, menus and tokens, aligned to a modern component library.
- Redesigned data grids (ag-Grid v33 theming) — the tables you live in are crisper and quicker.
- A shared component gallery keeps every screen visually consistent.
Saved, named and shareable dashboards
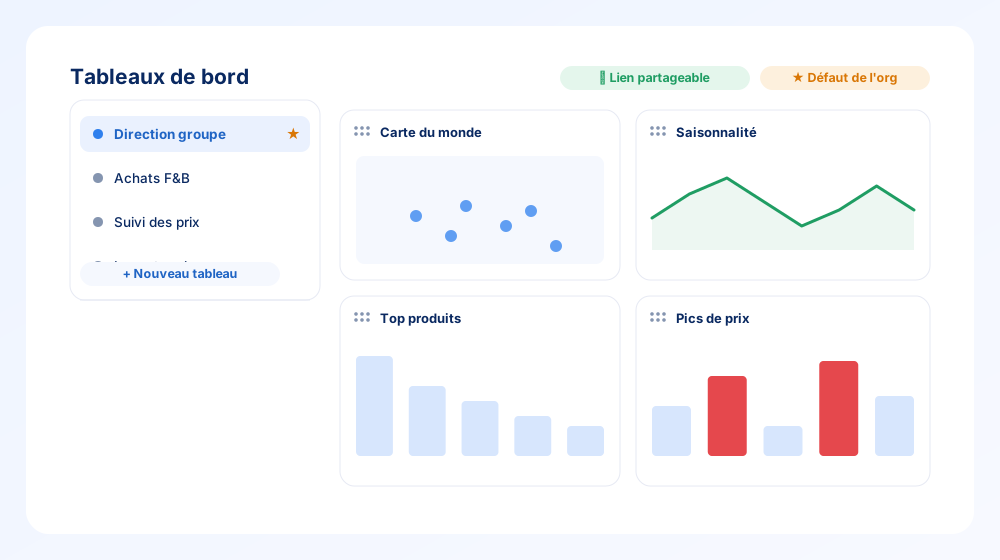
Dashboards are now yours to shape and share.
- Save & name as many dashboards as you like, and switch between them from the sidebar.
- Drag & drop, resize widgets on a customizable grid, with layouts remembered per scope.
- Shareable URL for any board, and an organisation default the owner can set.
- Layout auto-saves — the Save button is gone.
New dashboard widgets: origins map, seasonality & price spikes
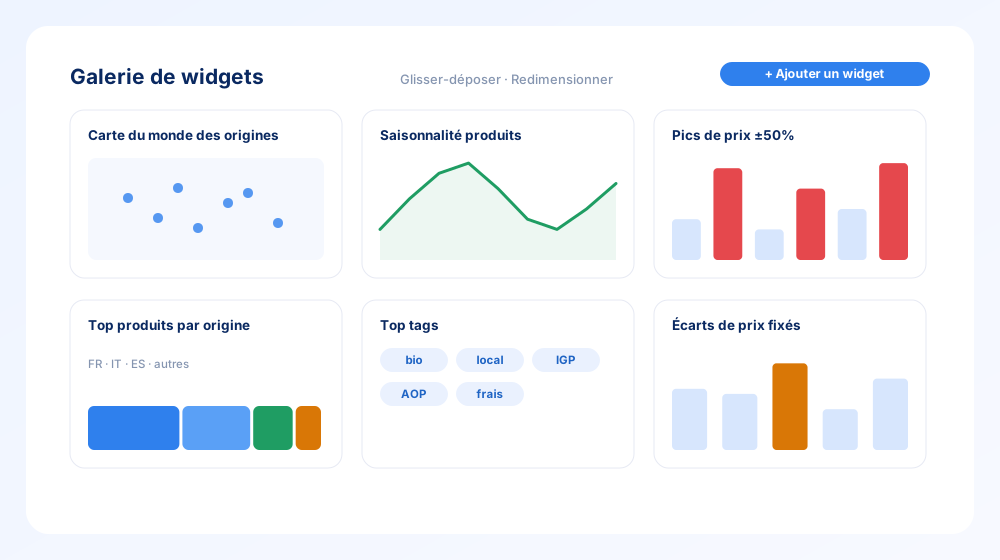
The add-widget gallery got a serious upgrade.
- World map of origins and top products by origin — see where your food actually comes from.
- Seasonality widget and a products seasonality column.
- Price spikes (period-independent, ±50% two-sided filter) and fixed-price gaps to catch drift fast.
- Top tags with clickable tags and product counts.
Supplier fixed prices, watched by a rules engine
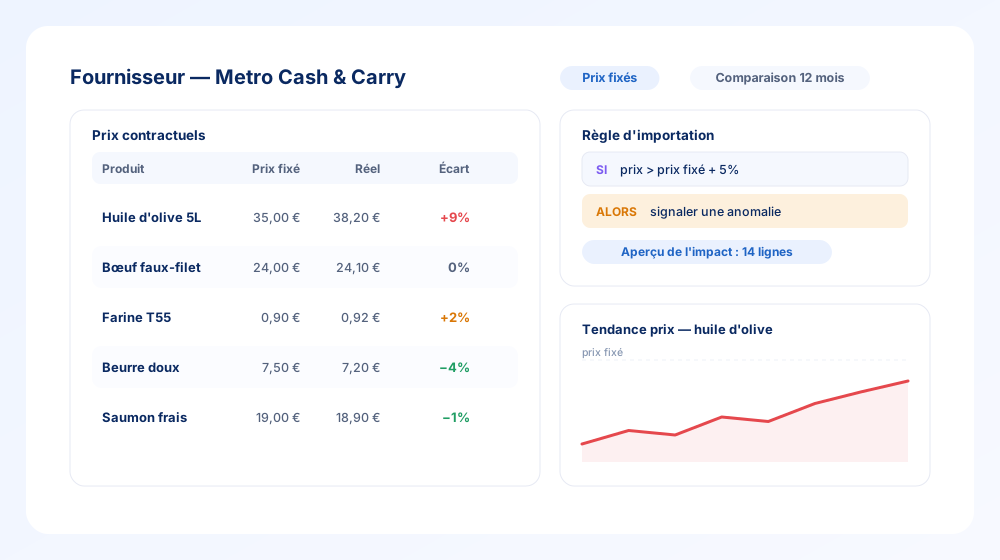
Negotiated a price? Hold your suppliers to it.
- Supplier fixed prices — enter them in the drawer, review and edit them inline on the supplier profile.
- A rules engine compares each imported line against the fixed price and raises an anomaly when it drifts.
- Impact preview at rule creation and create-and-apply retroactively across past documents.
- Comparison-period data added to the supplier drawer.
Automatic anomaly & duplicate detection on imports
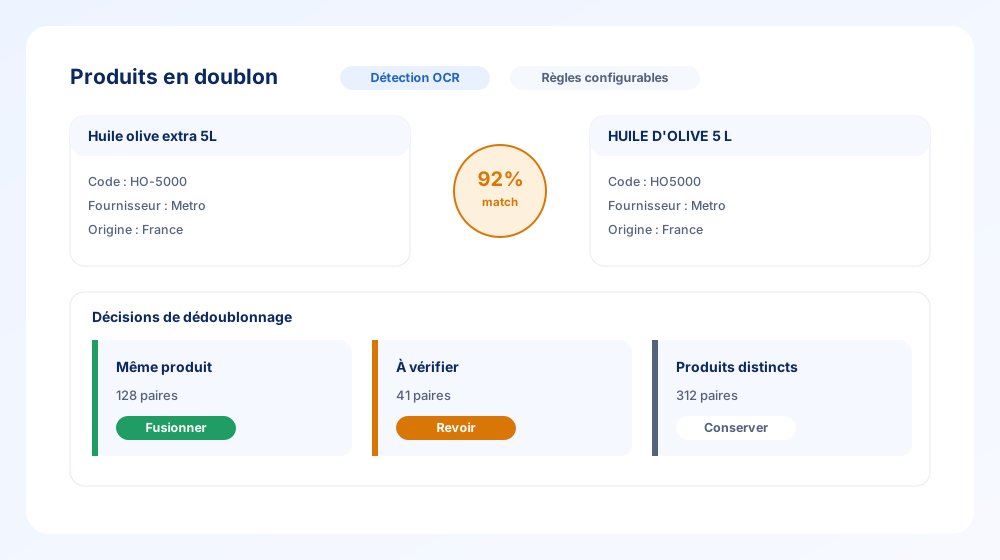
Messy supplier data gets cleaned up as it lands.
- Duplicate products review tab with a match score and merge decisions (same product / to review / distinct).
- Delivery-note duplicate detection with a merge mode.
- Configurable dedup rules and server-side decisions, so cleanup scales.
- A new Anomalies tab with rules, filters, grouping and side-effect previews.
A dedicated Impact section
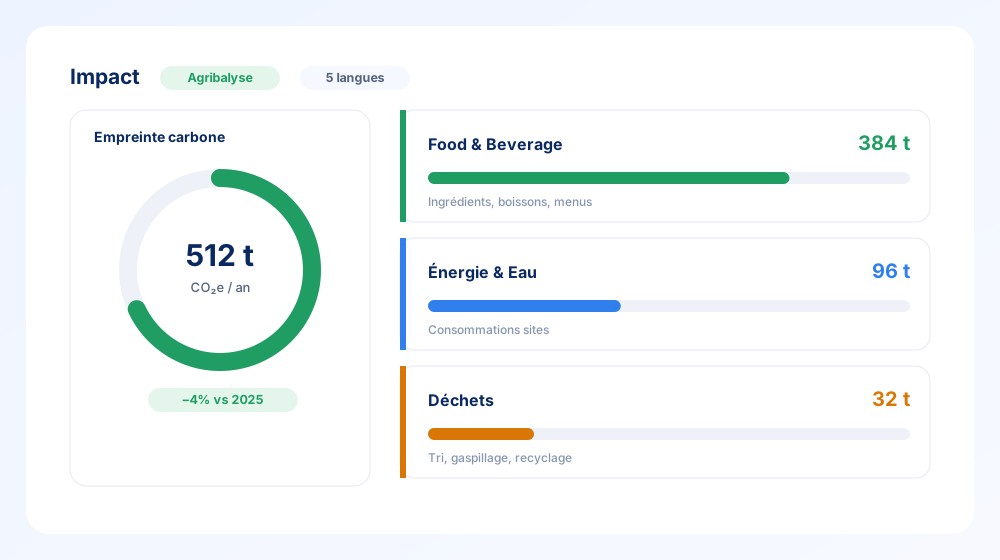
Sustainability now has its own home in Eqolux.
- New Impact menu with three sub-pages: Food & Beverage, Energy & Water and Waste.
- Carbon footprint estimated from your products via Agribalyse integration.
- Localized in 5 languages, with sample data so the story is clear from day one.
Saved views: your columns and periods, remembered

Stop re-arranging the same columns every morning.
- Save your column layout on any grid — order, width, visibility.
- Personal or shared: keep a view for yourself, or save it for the whole organisation.
- Your date range is remembered between visits, and a one-click reset brings back the defaults.
Choose your display currency
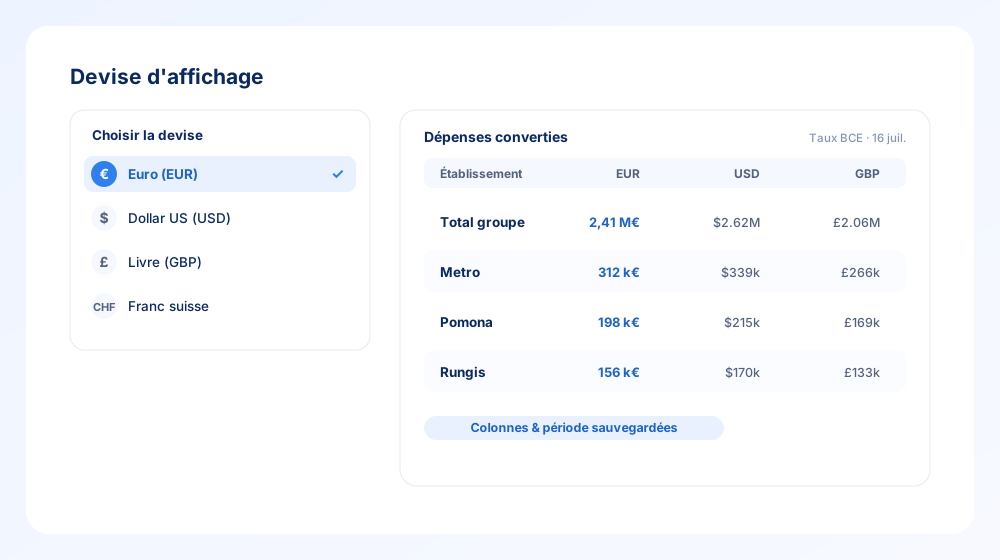
Purchasing across borders no longer means mental math.
- User-selectable display currency applied across dashboards, drawers and reports.
- Year-end rebates respect the chosen display currency too.
- Pairs with saved column layouts and auto-saved date ranges, so your working view stays put.
Tags get colours, a picker and grid filters

Tags are how you fold your own knowledge into the data — organic, local, contract, to-review. They just became first-class citizens.
- Colour-coded pills so a glance is enough to read a grid row.
- Quick picker: add or create a tag from anywhere, in two clicks.
- Tag filters in every grid, plus quick actions on supplier profiles.
- Tags display exactly as you wrote them — no forced capitalisation.
Create purchase orders & structured import rules
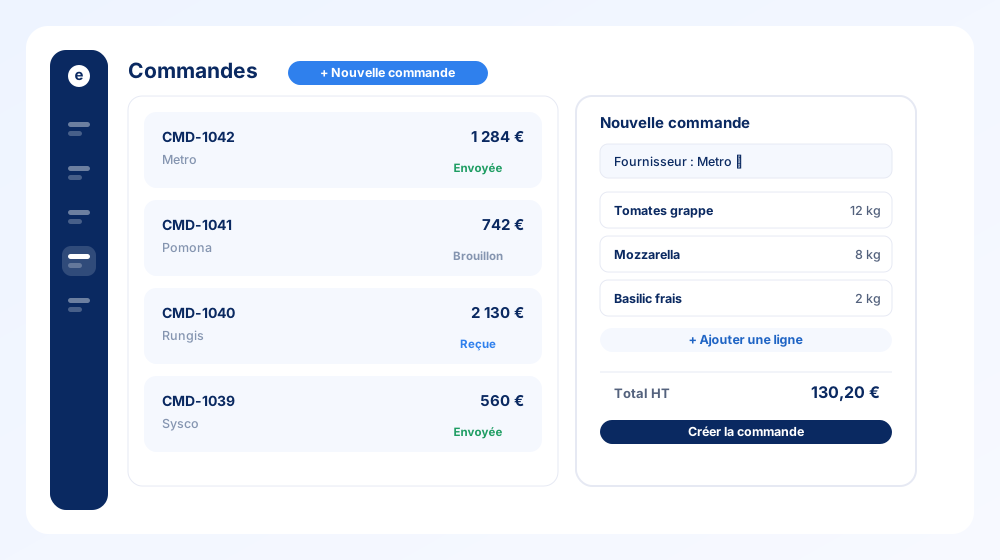
Two building blocks for a full purchasing loop.
- Orders page with a purchase-order creation drawer — pick a supplier, add lines, send.
- Structured importation rules with an AND/OR builder, so document parsing follows your logic.
- Rules tab on the Importations page with an editable drawer, localized end to end.
Multi-site selection, redesigned
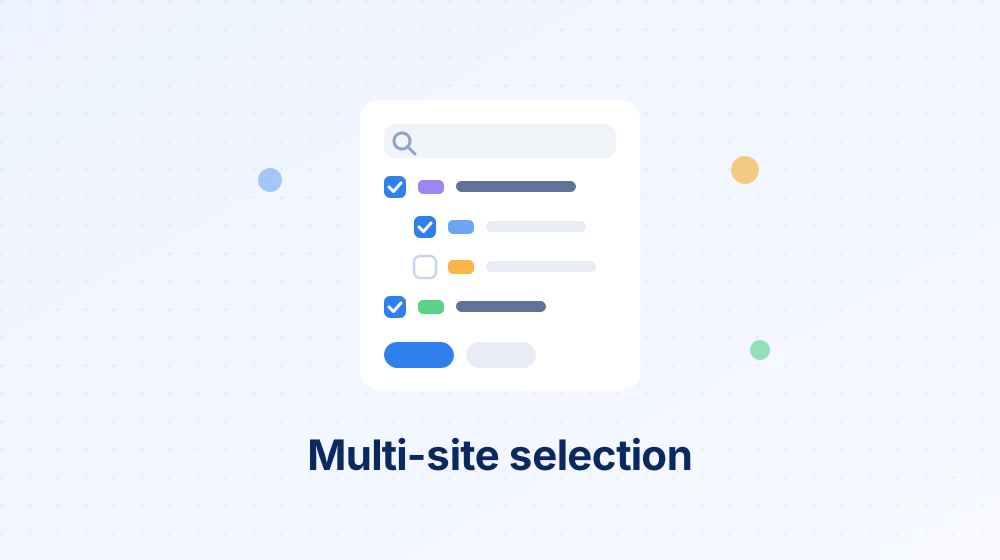
For hotel and restaurant groups, “which sites am I looking at?” is the first question on every screen. The selector now answers it properly.
- Multi-select: combine any set of entities — a whole brand, one country, or a single site.
- Search with auto-expansion: type a name and the matching branches open themselves.
- Clearer hierarchy, with initials badges for every site and collapsed groups by default.
Year-end rebates, tracked to the cent
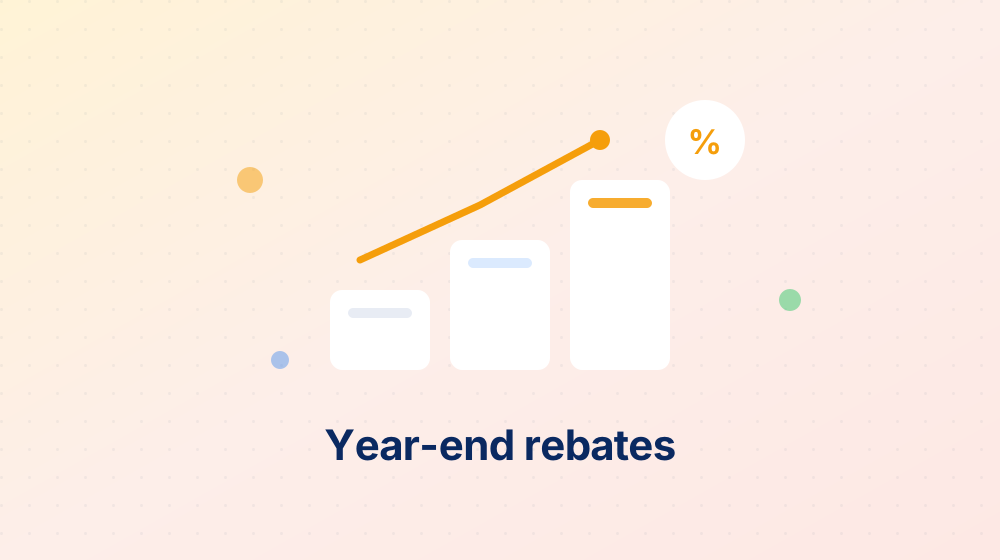
Year-end rebates (RFA) are real money — and usually tracked in a spreadsheet nobody trusts. Not anymore.
- One agreement per supplier, with its tiered thresholds and rates.
- Live progress: your purchase volume against each tier, updated as invoices come in.
- Amounts due computed to the cent, ready for the year-end negotiation.
Permission groups and easier user management

Purchasing data is sensitive — who sees what should be easy to control.
- Permission groups: define a set of rights once, assign it to many users.
- Per-site access: each role sees exactly the entities and data it should.
- A redesigned users area in Settings: invite, assign and update your team in bulk.
A faster, richer Products page
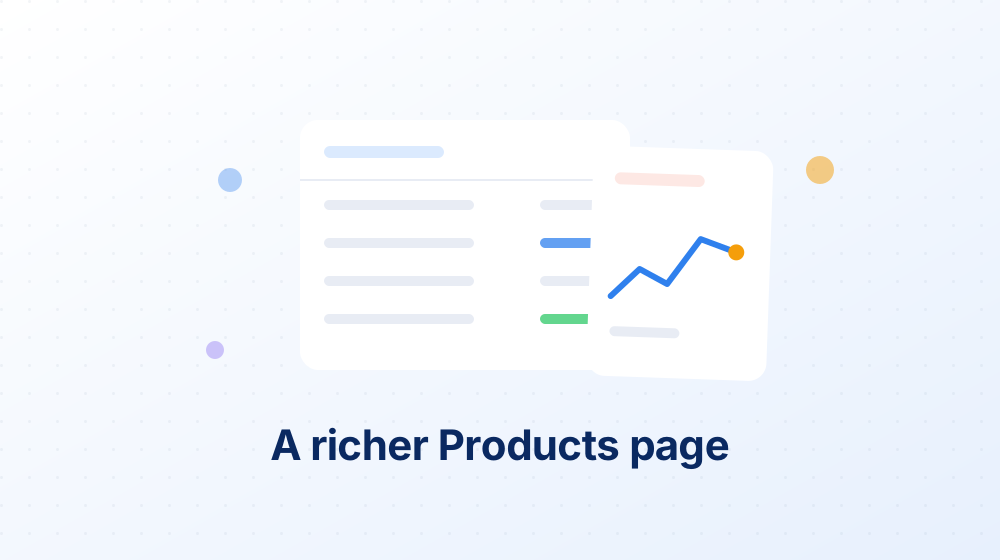
The Products area — where most purchasing questions start — received continuous improvements throughout March.
- A richer product drawer, with more context around each product and its orders.
- Clearer price information across the grid and charts.
- General polish: smoother navigation, fresher data and many small fixes.
Menu engineering: know what your menu earns

Your purchasing data already knows what every dish costs — now it tells you what your menu earns.
- Recipe builder connected to your real purchase prices, ingredient by ingredient.
- Menu engineering dashboard: dishes plotted by cost and performance, so stars and low performers stand out immediately.
- Spot the dishes that deserve a price change, a rework — or a bigger spot on the menu.
Custom icons and colours for your categories

Purchasing categories are the backbone of your analytics — they now look the part.
- Pick an icon and a colour for every category, from a curated icon library.
- Your choices carry through everywhere: dashboards, filters, product grids and drawers.
Guided onboarding and single sign-on (SSO)
Getting started with Eqolux is now a guided experience — and signing in fits your company’s security setup.
- Three-step onboarding walks every new account through its sites, suppliers and first data imports.
- Single sign-on (SSO) — sign in with your company identity provider; access stays centralised and secure.